Monthly Housing Payments Hit All-Time High
The median monthly mortgage payment reached a record high this week, putting a lid on pending home sales. New listings, on the other hand, are improving.
The typical U.S. homebuyer’s monthly housing payment hit an all-time high of $2,807 during the four weeks ending March 23, up 5.3% from a year earlier.
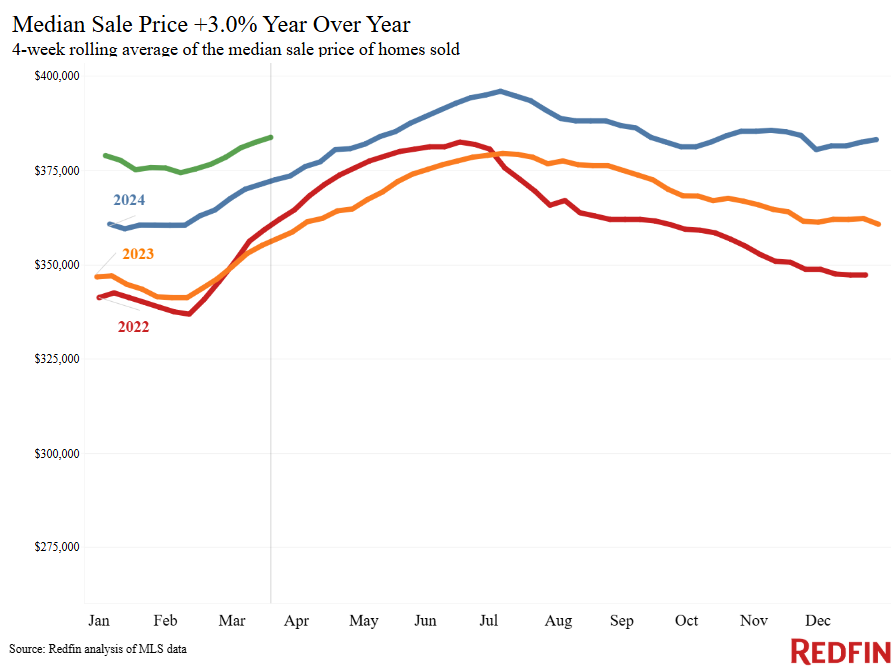
Housing costs are soaring for two reasons. One, sale prices keep rising; the median home-sale price is up 3% year over year. Two, the average weekly mortgage rate is 6.67%—more than double pandemic-era lows. But rates have dropped from an eight-month high of 7.04% in January; monthly payments would be even higher if not for the recent decline in rates.
High costs are putting a lid on home sales. Pending home sales are down 4.6% year over year, in line with the declines we’ve seen over the last few months. But as we enter spring, some house hunters are stepping off the sidelines, touring homes and applying for mortgages. Mortgage-purchase applications are at their highest level since the start of February on a seasonally adjusted basis, ShowingTime data signals that home tours are rising faster than they were last year, and Google searches of “homes for sale” are at their highest level since August.
Sellers are entering the market faster than buyers. New listings of homes for sale are up 7.5% year over year, the biggest increase so far in 2025. If new listings continue to rise and mortgage rates continue to decline, we may see pending sales improve in the coming months.
Redfin agents in many parts of the country say that even though costs are high, some buyers are able to negotiate in their favor.
“Buyers are cautious because they’re worried about the economy and potential layoffs, and they’re wondering if mortgage rates will come down later this year. But because other buyers are cautious too, some house hunters are getting homes for under asking price,” said Kimberly Freutel, a Redfin Premier agent in Sammamish, WA. “If you love a home and you see yourself living there for at least four or five years, make an offer you’re comfortable with, even if it’s a little below list. Don’t assume it will escalate out of your price range, because the seller might actually take it. I’m asking my clients, ‘Would you be sad if this home ends up selling for less than asking price to someone else?’”
For Redfin economists’ takes on the housing market, please visit Redfin’s “From Our Economists” page.
Leading indicators
| Indicators of homebuying demand and activity | ||||
| Value (if applicable) | Recent change | Year-over-year change | Source | |
| Daily average 30-year fixed mortgage rate | 6.8% (March 26) | Near lowest level since December | Down from 6.92% | Mortgage News Daily |
| Weekly average 30-year fixed mortgage rate | 6.67% (week ending March 20) | Up marginally from the week before, but near lowest level since mid-December | Down from 6.87% | Freddie Mac |
| Mortgage-purchase applications (seasonally adjusted) | Up 1% from a week earlier (as of week ending March 21) | Up 7% | Mortgage Bankers Association | |
| Touring activity | Up 37% from the start of the year (as of March 24) | At this time last year, it was up 29% from the start of 2024 | ShowingTime, a home touring technology company | |
| Google searches for “home for sale” | Up 12% from a month earlier (as of March 24) | Up 14% | Google Trends | |
| We excluded the Redfin Homebuyer Demand Index this week to ensure data accuracy. | ||||
Key housing-market data
| U.S. highlights: Four weeks ending March 23, 2025
Redfin’s national metrics include data from 400+ U.S. metro areas, and are based on homes listed and/or sold during the period. Weekly housing-market data goes back through 2015. Subject to revision. |
|||
| Four weeks ending March 23, 2025 | Year-over-year change | Notes | |
| Median sale price | $383,750 | 3% | |
| Median asking price | $424,985 | 6.3% | |
| Median monthly mortgage payment | $2,807at a 6.67% mortgage rate | 5.3% | Record high |
| Pending sales | 83,161 | -4.6% | |
| New listings | 99,152 | 7.5% | Biggest increase of 2025 |
| Active listings | 970,228 | 11.3% | Smallest increase in a year |
| Months of supply | 3.9 | +0.6 pts. | 4 to 5 months of supply is considered balanced, with a lower number indicating seller’s market conditions |
| Share of homes off market in two weeks | 37.3% | Down from 41% | |
| Median days on market | 48 | +7 days | |
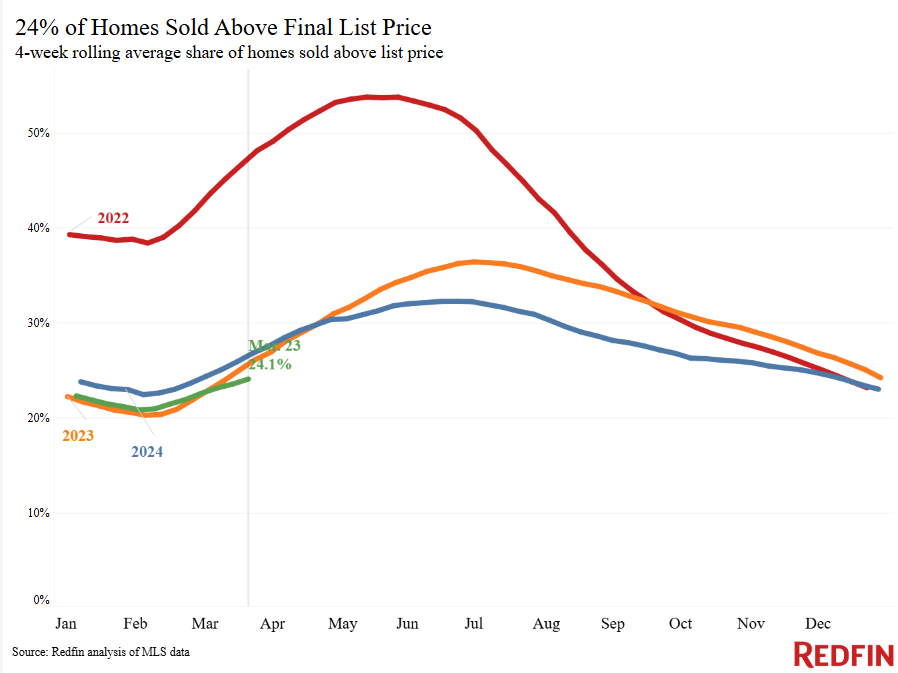
| Share of homes sold above list price | 24.1% | Down from 26% | |
| Average sale-to-list price ratio |
98.5% |
Down from 98.8% | |
|
Metro-level highlights: Four weeks ending March 23, 2025 Redfin’s metro-level data includes the 50 most populous U.S. metros. Select metros may be excluded from time to time to ensure data accuracy. |
|||
|---|---|---|---|
| Metros with biggest year-over-year increases | Metros with biggest year-over-year decreases |
Notes |
|
| Median sale price | Cleveland (11.3%)
Nassau County, NY (10.1%) Newark, NJ (9.4%) Milwaukee (8.9%) Anaheim, CA (7.8%) |
Jacksonville, FL (-3.7%)
Tampa, FL (-2.5%) Austin, TX (-1.9%) Baltimore (-0.9%) Atlanta (-0.8%) |
Declined in 9 metros |
| Pending sales | Montgomery County, PA (5.5%)
Sacramento, CA (2.8%) Denver (2.4%) Pittsburgh (1.3%) Columbus, OH (1.1%) |
Fort Lauderdale, FL (-19.5%)
Detroit (-17%) Warren, MI (-15.5%) Houston (-13.7%) Miami (-13.4%) |
Increased in 6 metros |
| New listings | Phoenix (23.6%)
Denver (22.9%) Sacramento, CA (18.7%) Washington, D.C. (18%) Oakland, CA (17.7%) |
Detroit (-7%)
San Antonio (-5%) Nassau County, NY (-4.3%) Newark, NJ (-4%) Warren, MI (-2.4%) |
Declined in 7 metros |
Refer to our metrics definition page for explanations of all the metrics used in this report.


The post Monthly Housing Payments Hit All-Time High appeared first on Redfin Real Estate News.
Categories
Recent Posts


